AAOI: The Gap That Couldn’t Hold
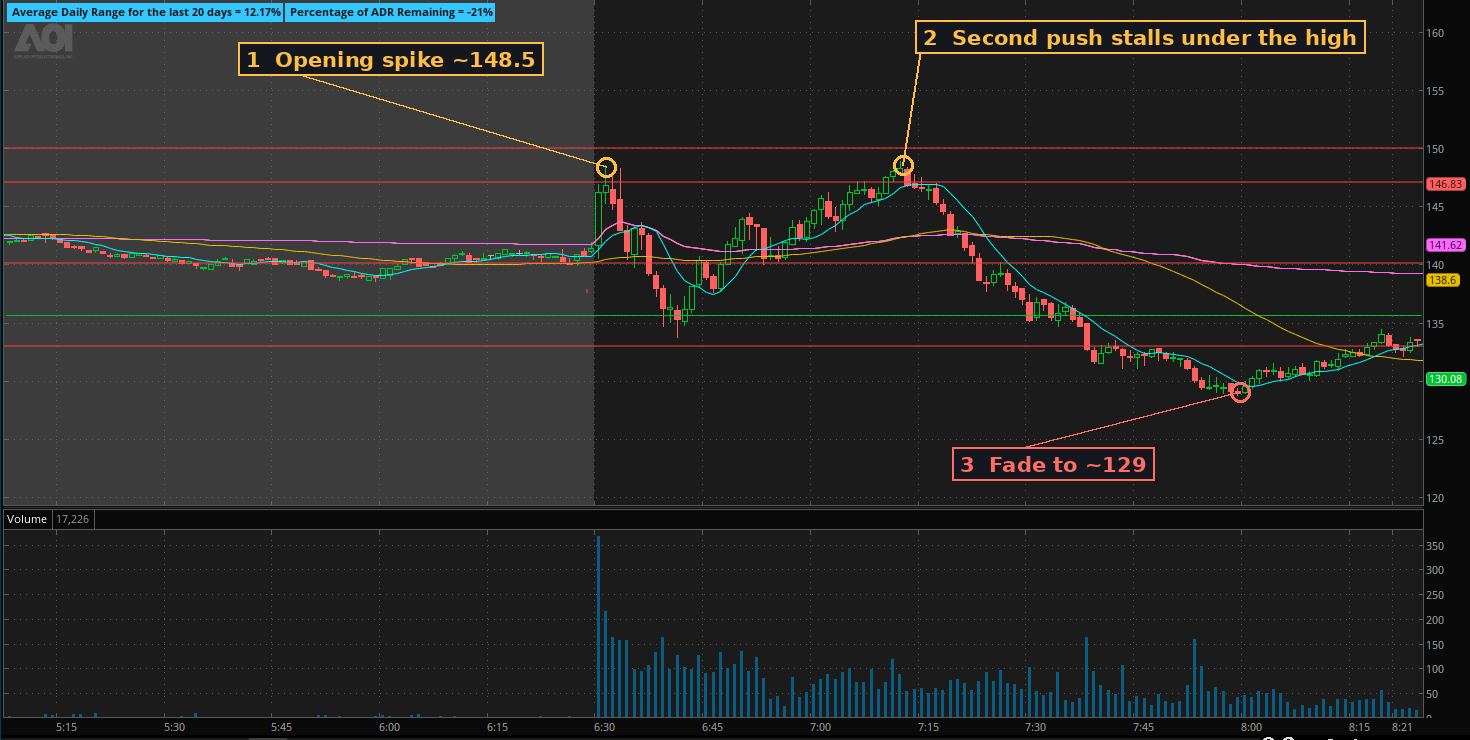
A big gap, a fast spike at the bell, and a second push that ran out of buyers just under the high. The chart told you what was coming before the fade started.
The setup
Draft. Replace with your own words. AAOI gapped up almost 13% and spiked on the open, putting in a high around 148.5 on the heaviest volume of the day.
What I saw
The first flush found buyers near 134, and the stock rebuilt back over VWAP. But the second push stalled just under the opening high. That was the tell.
The trade
- Entry: where you got in, and why there
- Stop: where you were wrong
- Exit: where you took it off
What I'd do differently
One or two lines on the lesson.